Can you upload the map? You changed the "Max load limit" tables to a higher value than you log, right?
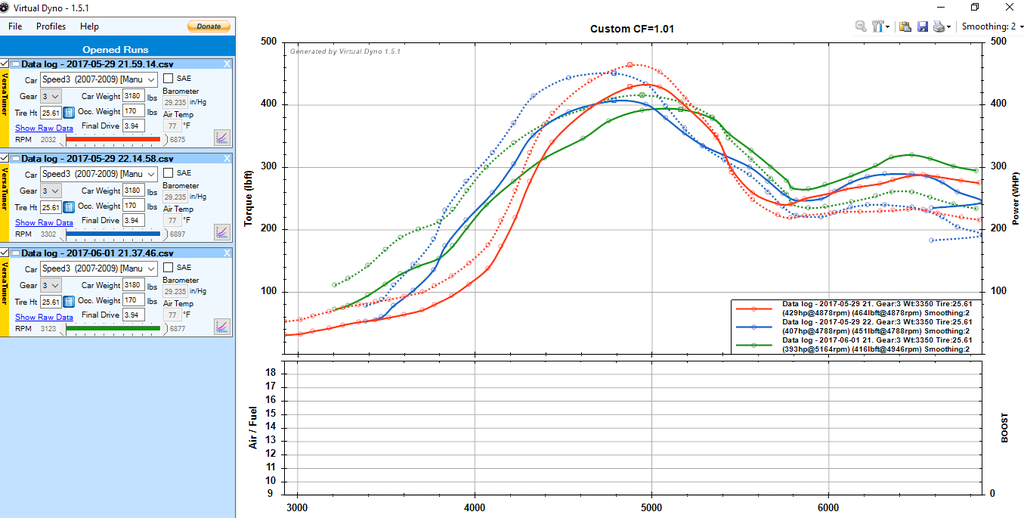
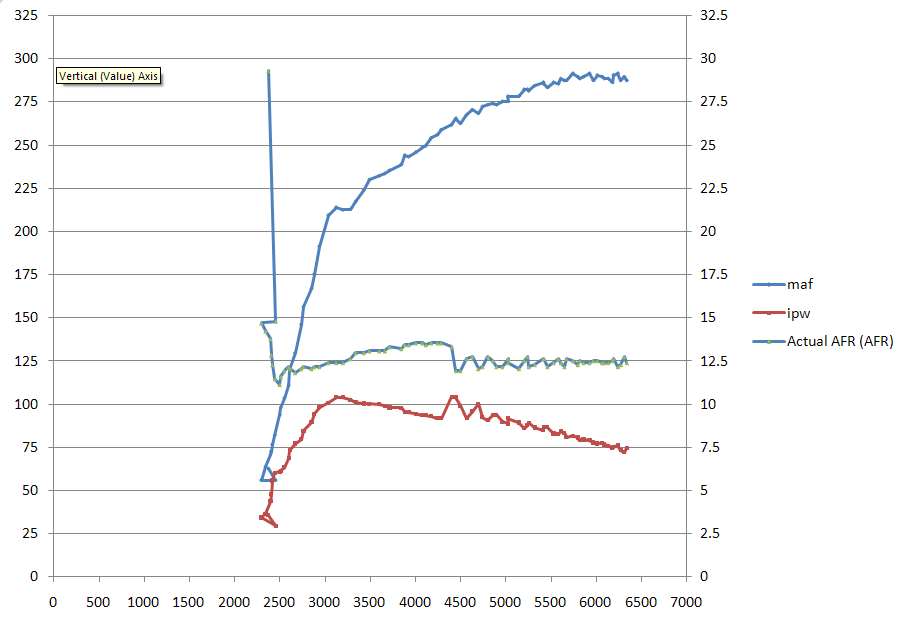
edit: Also I suspect there is a problem with the chart function in VT because when I manually graph this log in excel, I don't get that really crazy looking choppiness in IDC that you do.
Sent from my A0001 using Tapatalk
edit: Also I suspect there is a problem with the chart function in VT because when I manually graph this log in excel, I don't get that really crazy looking choppiness in IDC that you do.
Sent from my A0001 using Tapatalk
Last edited: