phate
Motorhead
We're talking about turning. Autocross, road racing, canyons and mountains. Drag racers need not read any further.
What if I told you general car setup involved nothing more than a few things added, subtracted, multiplied, or divided? General car setup is that simple, no black magic, no ridiculous formulas looking at anything but the basics of springs and levers. This post is probably going to take a few installments, because it will be lengthy. At the end, though, if you apply these principles you can use them to assess your current setup and maybe even figure out why your car is behaving the way it is, and most importantly - how to fix that behavior and go faster.
The first step in this is to look at steady state cornering behavior. That means after the car has taken set and you aren't trying to flick the back end around or anything like that, and then seeing if it's understeering or oversteering. That also means we aren't including shock forces, since they only contribute force during transient motion (they're velocity sensitive). I highly suggest you get the idea of 'neutral' handling out of your head. Just assume it doesn't exist, and if you think your car is 'neutral', then assume that you weren't driving it hard enough.
I'm going to make a couple claims without backing them up") The main thing we want to know is how stiff the car is in the front vs the rear, and how that relates to the turning behavior of the car. We end up comparing the % stiffness contributed from the front end to the % front weight of the car. Let's call front % stiffness the roll bias, and let's call the front % weight the weight bias. It comes down to this general idea:
The main thing we want to know is how stiff the car is in the front vs the rear, and how that relates to the turning behavior of the car. We end up comparing the % stiffness contributed from the front end to the % front weight of the car. Let's call front % stiffness the roll bias, and let's call the front % weight the weight bias. It comes down to this general idea:
Quick example of an MS3:
Weight bias: 60%
Roll bias: 80% <--yes, that's close to actual
Result: UNDERSTEER. We've all experienced it, we all know it to be true.
So how do we fix that? Well, we can't really shift the weight bias, so it comes down to roll bias. Everyone wants a bigger rear bar, and this is the real reason. More rear stiffness decreases the roll bias, and when roll bias gets close to weight bias we start to get a less understeering monster, and we can even get into the realm of steady state oversteer if things are stiff enough.
Finding weight bias is easy. Get on some scales and math it out or maybe the scales even have a front weight readout. Easy peasy.
Finding Roll Bias is what we're really trying to do, here. Yes, you can slap on different bars and springs and bump stops until you find something that works, but why waste that money when you can get it very, very close just using some math? At the end of this, we'll be able to throw this into a spreadsheet and you can see exactly what is going on and change whatever parameters you want. Door cars lend themselves to the analysis I'm about to do because the front and rear track widths are equal or very close to equal. When that's the case, you don't need to go into actual weight transfer stuff or into roll angles or anything else, that's just extra if you want it...
So where does roll stiffness (and bias) come from? Well, it comes from the things that resist roll:
Now how do we add all that stuff together to give us the right numbers? They attach at different points on the control arms and some even at angles (think the shocks and struts). To put everything onto a level playing field, we're going to normalize everything to act as if it were working directly in line and completely vertical with the center of the tire.

MOTION RATIO
Pretty simple idea, right? So let's see how we actually do that. First, let's talk about motion ratio. The motion ratio is just that, a ratio of movement between two points on a single object. That object, for us, is the lower control arm. The points we are comparing are always something versus the vertical wheel movement - that means springs, sway bars, shocks, and bump stops. For example, we would like to express spring movement - how much it compresses - versus the wheel movement.
Expressing this motion ratio mathematically is just a little bit of trig:

There's one nuance with springs and motion ratios. Springs essentially lose leverage twice by a factor of the motion ratio. This is because force is lost by a factor of the motion ratio, and the distance displaced by the wheel is inversely proportional to that of the spring by a factor of the motion ratio. So the reduced force is divided by the increased distance...If you would like to see an example and proof of this, click here.
Now that we know what motion ratios (henceforth referred to just as MR) are and where they come from, let's look at what has an MR and how we're going to keep everything straight:

^In this thread text, I'll use something like MR_F,K if I need to type something out.
A slight detour
Essentially, we just want to add up everything for the front, and add up everything for the rear, and compare.

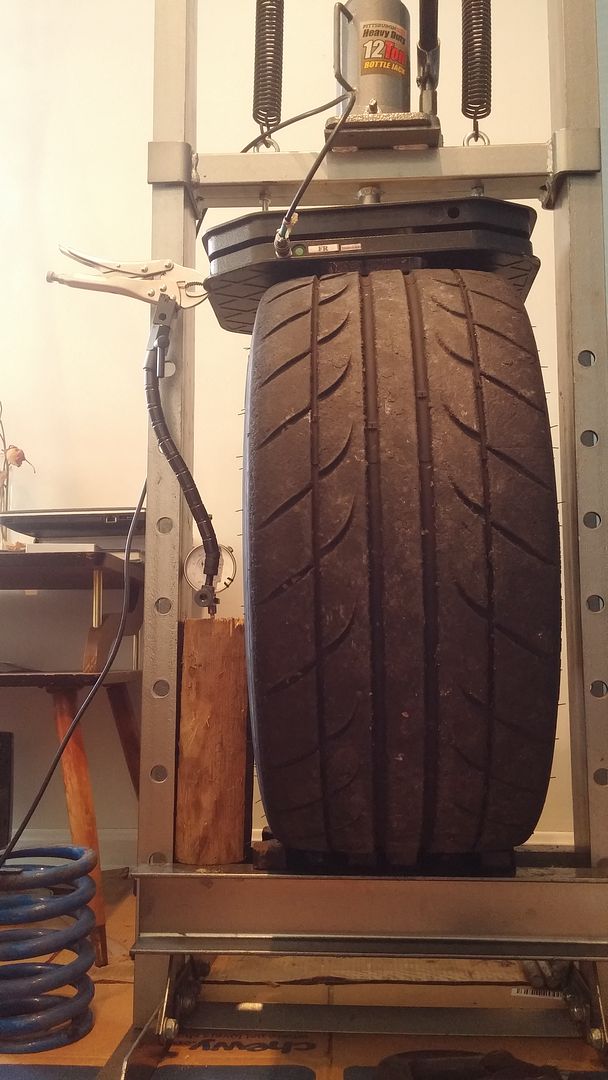
For the main spring, ARB*, and bump stop, we can simply add them up for a combined spring rate. These act like parallel springs, meaning they just work and add together directly. One thing we haven't considered yet is tire stiffness! If you watched the video above, you have seen just how floppy tires are. They act just like springs! This spring, though, acts in series between the wheel and other springs we've already calculated. (*see Spring Specifics section for details)
You say it doesn't matter? I disagree, and I'll use my car as an example. I hadn't been using tire spring rates in my calculations and they were telling me that I was still pretty far away from the neutral steer point on the understeer side. But, slight changes to rear bias were getting appreciable oversteer results so it seemed we were closer to the neutral point than the numbers indicated. I actually tested my tire spring rate (more on that testing later) and recalculated the front bias. The numbers were revealing:
.JPG")
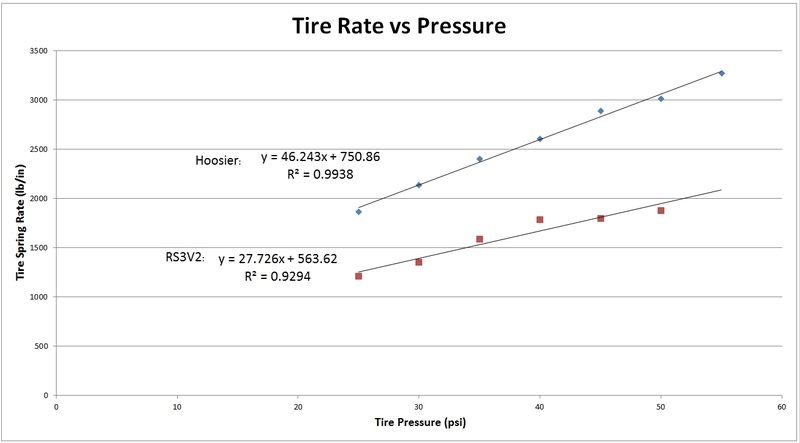
So just by including one more piece of information we found that calculated results had become much closer to what we were experiencing. This is with a fairly stiff tire, too (Hankook RS3V2). The softer a tire is, the more pronounced the effect will be. The softer a tire is, the more it will reduce the overall rate - the overall spring rate of springs in series will be lower than the lowest spring's rate.
We'll talk about tire rate testing in a later post. For now, just remember that it can influence the stiffness quite a bit. The formula for the overall spring rate for two springs in series is simple:
Overall rate = (k1 x k2) / (k1 + k2)
Spring Specifics
Alright, there's a couple caveats with each type of spring that we need to talk about.
Sway bars - henceforth referred to as anti-roll bars or ARBs. How sway bars are rated can be extremely misleading. Even the formula for sway bar stiffness can be misleading since it gives you a rate in lb/in, which seems perfect for what we need.
ARB's are rated by a bench rate. A bench rate is the rate of the bar with one end held in place and the other end deflected. The problem with that is how it actually works on a car. When we enter a turn and the chassis rolls a little bit, one side compresses, but the other side extends. This means the ARB is actually twisting twice the amount**. (**It's not really twice the amount since the droop side may not extend as much as the other side went into bump, but we'll assume twice the amount for now.
The theoretical bench rate of a sway bar is easily calculated for the MS3 bars and the front MS6 bar. They are simple, geometrically, and this formula is fairly accurate:

^Note those variables are in inches, and the formula yields results in units of lb/in.
That formula comes from combining three springs together, as detailed in this link. There's a factor of 10 error in that paper that I'll let you find
This formula assumes rigid bushings, meaning no squish or deflection in them. That is NOT how our sway bars are set up, they have soft rubber or polyurethane bushings. I have actually strapped ARB's into test rigs to verify the reduction in stiffness. It can be immense. Like the above note says, for thick rubber bushings (stock), the rate is reduced upwards of 50%, and even with 'stiff' polyurethane bushings the rate was reduced nearly 40%. Like the tire spring rates, it's another thing to consider that will make our calculations more accurate.
Bump Stops - bump stops can be tricky to incorporate into this equation. They don't touch at ride height, so they begin to work somewhere in roll. Good bump stops will have a linear-ish spring rate range, but if you compress them enough they will go solid. Solid means infinite spring rate, and that means your bias goes way up or way down very quickly. Bump stops are a great tuning tool, but not so much a great main spring (like how the MS3 and MS6 utilize them in stock form).
Main Springs - No real caveats here. If you use squishy rubber spring seats they act like springs in series, again...meaning it lowers their rate a touch. They go solid pretty quickly so I probably wouldn't worry about this too much.
I have rate tested some springs and have found they aren't completely linear, even if advertised as linear. They have a linear range, but no two springs are perfect. You can test them yourself (more on this later), or you can pay some shops to rate test them for you. It's another thing to do to make your calculations a little more accurate.
Let's put it all together
Since door cars are close to equal left to right, we can simply take a front corner's stiffness and a rear corner's stiffness for this analysis. We calculate the total corner stiffness from everything contributing:

^The extra 'e' designation in that equation for each of the spring rates just means "effective", as in the effective rate acting at the tire.
Then you simply compare the front stiffness to the total front and rear stiffness to get the % front bias:

And then we're back to comparing % front bias to % front weight...
Looking forward a bit, you can see how easy this sort of analysis would be to implement in Excel. If you wanted to get fancy, you could add drop downs for selecting different bars, springs, tires, or anything mentioned so far. I have a calculator built for this (and more), already, and I'll share some of it in here.
I'll also show some examples of how I have tested various components. I've had sway bars, springs, and tires in test rigs trying to get accurate numbers for them and have learned some things along the way that I'll share.
What if I told you general car setup involved nothing more than a few things added, subtracted, multiplied, or divided? General car setup is that simple, no black magic, no ridiculous formulas looking at anything but the basics of springs and levers. This post is probably going to take a few installments, because it will be lengthy. At the end, though, if you apply these principles you can use them to assess your current setup and maybe even figure out why your car is behaving the way it is, and most importantly - how to fix that behavior and go faster.
The first step in this is to look at steady state cornering behavior. That means after the car has taken set and you aren't trying to flick the back end around or anything like that, and then seeing if it's understeering or oversteering. That also means we aren't including shock forces, since they only contribute force during transient motion (they're velocity sensitive). I highly suggest you get the idea of 'neutral' handling out of your head. Just assume it doesn't exist, and if you think your car is 'neutral', then assume that you weren't driving it hard enough.
I'm going to make a couple claims without backing them up
The main thing we want to know is how stiff the car is in the front vs the rear, and how that relates to the turning behavior of the car. We end up comparing the % stiffness contributed from the front end to the % front weight of the car. Let's call front % stiffness the roll bias, and let's call the front % weight the weight bias. It comes down to this general idea:- If roll bias = weight bias, neutral handling (doesn't exist, so go to the next line)
- If roll bias > weight bias, understeer (I'm looking at you, MS3's)
- If roll bias < weight bias, oversteer
Quick example of an MS3:
Weight bias: 60%
Roll bias: 80% <--yes, that's close to actual
Result: UNDERSTEER. We've all experienced it, we all know it to be true.
So how do we fix that? Well, we can't really shift the weight bias, so it comes down to roll bias. Everyone wants a bigger rear bar, and this is the real reason. More rear stiffness decreases the roll bias, and when roll bias gets close to weight bias we start to get a less understeering monster, and we can even get into the realm of steady state oversteer if things are stiff enough.
Finding weight bias is easy. Get on some scales and math it out or maybe the scales even have a front weight readout. Easy peasy.
Finding Roll Bias is what we're really trying to do, here. Yes, you can slap on different bars and springs and bump stops until you find something that works, but why waste that money when you can get it very, very close just using some math? At the end of this, we'll be able to throw this into a spreadsheet and you can see exactly what is going on and change whatever parameters you want. Door cars lend themselves to the analysis I'm about to do because the front and rear track widths are equal or very close to equal. When that's the case, you don't need to go into actual weight transfer stuff or into roll angles or anything else, that's just extra if you want it...
So where does roll stiffness (and bias) come from? Well, it comes from the things that resist roll:
- Main Springs
- Anti-Roll Bars (ARB, aka Sway Bar)
- Bump Stops
- Shocks (which we're ignoring!)
- Tires - tires are not rigid cylinders, they compress quite a lot. Check this out, they're all sorts of floppy
Now how do we add all that stuff together to give us the right numbers? They attach at different points on the control arms and some even at angles (think the shocks and struts). To put everything onto a level playing field, we're going to normalize everything to act as if it were working directly in line and completely vertical with the center of the tire.
MOTION RATIO
Pretty simple idea, right? So let's see how we actually do that. First, let's talk about motion ratio. The motion ratio is just that, a ratio of movement between two points on a single object. That object, for us, is the lower control arm. The points we are comparing are always something versus the vertical wheel movement - that means springs, sway bars, shocks, and bump stops. For example, we would like to express spring movement - how much it compresses - versus the wheel movement.
Expressing this motion ratio mathematically is just a little bit of trig:
There's one nuance with springs and motion ratios. Springs essentially lose leverage twice by a factor of the motion ratio. This is because force is lost by a factor of the motion ratio, and the distance displaced by the wheel is inversely proportional to that of the spring by a factor of the motion ratio. So the reduced force is divided by the increased distance...If you would like to see an example and proof of this, click here.
Now that we know what motion ratios (henceforth referred to just as MR) are and where they come from, let's look at what has an MR and how we're going to keep everything straight:
^In this thread text, I'll use something like MR_F,K if I need to type something out.
A slight detour
Essentially, we just want to add up everything for the front, and add up everything for the rear, and compare.
For the main spring, ARB*, and bump stop, we can simply add them up for a combined spring rate. These act like parallel springs, meaning they just work and add together directly. One thing we haven't considered yet is tire stiffness! If you watched the video above, you have seen just how floppy tires are. They act just like springs! This spring, though, acts in series between the wheel and other springs we've already calculated. (*see Spring Specifics section for details)
You say it doesn't matter? I disagree, and I'll use my car as an example. I hadn't been using tire spring rates in my calculations and they were telling me that I was still pretty far away from the neutral steer point on the understeer side. But, slight changes to rear bias were getting appreciable oversteer results so it seemed we were closer to the neutral point than the numbers indicated. I actually tested my tire spring rate (more on that testing later) and recalculated the front bias. The numbers were revealing:
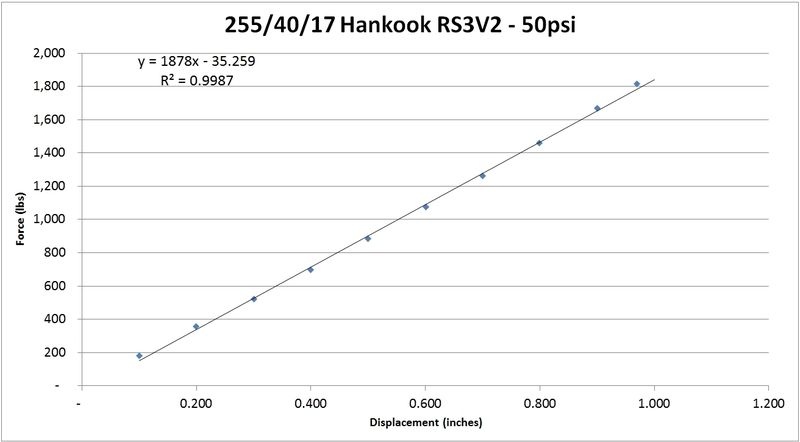
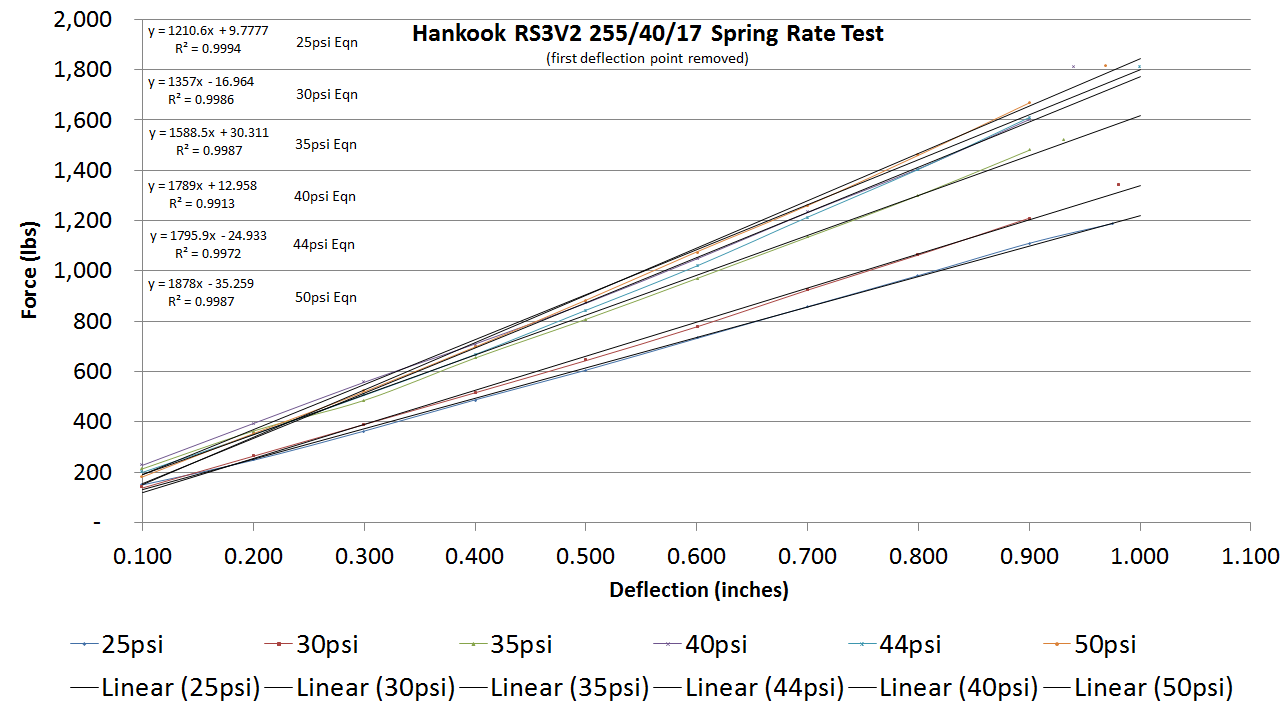
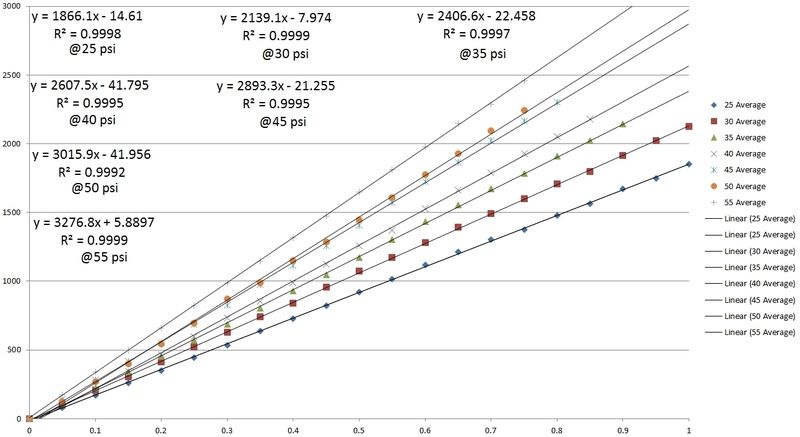
So just by including one more piece of information we found that calculated results had become much closer to what we were experiencing. This is with a fairly stiff tire, too (Hankook RS3V2). The softer a tire is, the more pronounced the effect will be. The softer a tire is, the more it will reduce the overall rate - the overall spring rate of springs in series will be lower than the lowest spring's rate.
We'll talk about tire rate testing in a later post. For now, just remember that it can influence the stiffness quite a bit. The formula for the overall spring rate for two springs in series is simple:
Overall rate = (k1 x k2) / (k1 + k2)
Spring Specifics
Alright, there's a couple caveats with each type of spring that we need to talk about.
Sway bars - henceforth referred to as anti-roll bars or ARBs. How sway bars are rated can be extremely misleading. Even the formula for sway bar stiffness can be misleading since it gives you a rate in lb/in, which seems perfect for what we need.
ARB's are rated by a bench rate. A bench rate is the rate of the bar with one end held in place and the other end deflected. The problem with that is how it actually works on a car. When we enter a turn and the chassis rolls a little bit, one side compresses, but the other side extends. This means the ARB is actually twisting twice the amount**. (**It's not really twice the amount since the droop side may not extend as much as the other side went into bump, but we'll assume twice the amount for now.
The theoretical bench rate of a sway bar is easily calculated for the MS3 bars and the front MS6 bar. They are simple, geometrically, and this formula is fairly accurate:
^Note those variables are in inches, and the formula yields results in units of lb/in.
That formula comes from combining three springs together, as detailed in this link. There's a factor of 10 error in that paper that I'll let you find
This formula assumes rigid bushings, meaning no squish or deflection in them. That is NOT how our sway bars are set up, they have soft rubber or polyurethane bushings. I have actually strapped ARB's into test rigs to verify the reduction in stiffness. It can be immense. Like the above note says, for thick rubber bushings (stock), the rate is reduced upwards of 50%, and even with 'stiff' polyurethane bushings the rate was reduced nearly 40%. Like the tire spring rates, it's another thing to consider that will make our calculations more accurate.
Bump Stops - bump stops can be tricky to incorporate into this equation. They don't touch at ride height, so they begin to work somewhere in roll. Good bump stops will have a linear-ish spring rate range, but if you compress them enough they will go solid. Solid means infinite spring rate, and that means your bias goes way up or way down very quickly. Bump stops are a great tuning tool, but not so much a great main spring (like how the MS3 and MS6 utilize them in stock form).
Main Springs - No real caveats here. If you use squishy rubber spring seats they act like springs in series, again...meaning it lowers their rate a touch. They go solid pretty quickly so I probably wouldn't worry about this too much.
I have rate tested some springs and have found they aren't completely linear, even if advertised as linear. They have a linear range, but no two springs are perfect. You can test them yourself (more on this later), or you can pay some shops to rate test them for you. It's another thing to do to make your calculations a little more accurate.
Let's put it all together
Since door cars are close to equal left to right, we can simply take a front corner's stiffness and a rear corner's stiffness for this analysis. We calculate the total corner stiffness from everything contributing:
^The extra 'e' designation in that equation for each of the spring rates just means "effective", as in the effective rate acting at the tire.
Then you simply compare the front stiffness to the total front and rear stiffness to get the % front bias:
And then we're back to comparing % front bias to % front weight...
- If roll bias = weight bias, neutral handling (doesn't exist, so go to the next line)
- If roll bias > weight bias, understeer (I'm looking at you, MS3's)
- If roll bias < weight bias, oversteer
Looking forward a bit, you can see how easy this sort of analysis would be to implement in Excel. If you wanted to get fancy, you could add drop downs for selecting different bars, springs, tires, or anything mentioned so far. I have a calculator built for this (and more), already, and I'll share some of it in here.
I'll also show some examples of how I have tested various components. I've had sway bars, springs, and tires in test rigs trying to get accurate numbers for them and have learned some things along the way that I'll share.
Last edited:


")